Many clients now require their suppliers to present robust project schedules with very high confidence levels for project success. Primavera Risk Analysis (PRA) is one of the leading tools for risk assessing your project schedules. PRA is used to perform schedule validation and embed your own risk models with fully developed risk events. The tools available in PRA enable you to build a fully risk impacted plan. Delivering a fully risk adjusted schedule places suppliers at the head of the queue. The end result is a more robust schedule with a high probability of success and a confidence level of 90%.
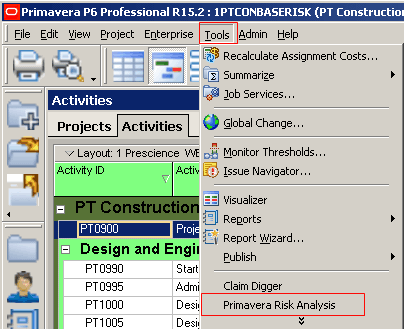
- Oracle Primavera Risk Analysis fully integrates with Primavera P6 and can be launched from within P6.
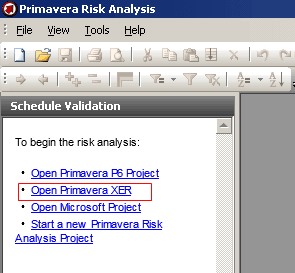
- Alternatively, P6 schedules can be imported with Primavera Risk Analysis as a naked P6 XER file.
Five Steps to develop, build and execute best performance schedules

Developing fully risk adjusted schedules should follow a systematic process.
- Start with Schedule Validation, which will identify any basic schedules problems, such as broken logic or lag.
- Perform the Pre-Analysis check
- Develop and import Risk Models
- Run Risk Analysis
- Review the results
After completing the five steps, you will be ready to build the fully risk adjusted schedule and execute the schedule with far greater confidence. Read on for an in-depth analysis of the most important steps in this process.
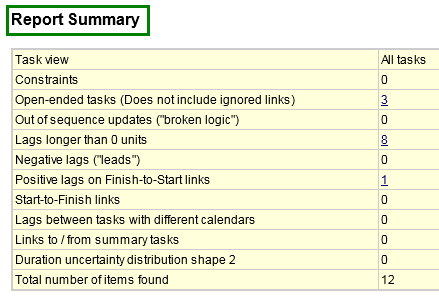
Schedule Validation
PRA generates an extensive Schedule Validation report that records any basic scheduling defects. This report can be used to correct a schedule before proceeding to the Schedule Pre–analysis check.

Perform Pre-Analysis Check
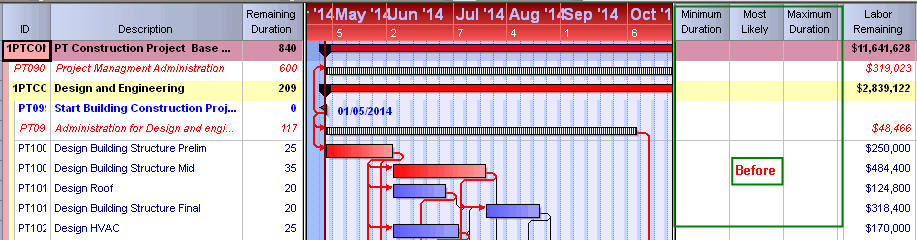
The Schedule Pre–analysis check starts with the imported schedule that has been checked and corrected as required. The next step is to load the Duration quick Risk values. If confidence in the schedule composition is high then the Minimum and Maximum range values can be adjusted. Duration Quick Risk values typically display per the image below.

- This is the screen before loading the quick risk values.
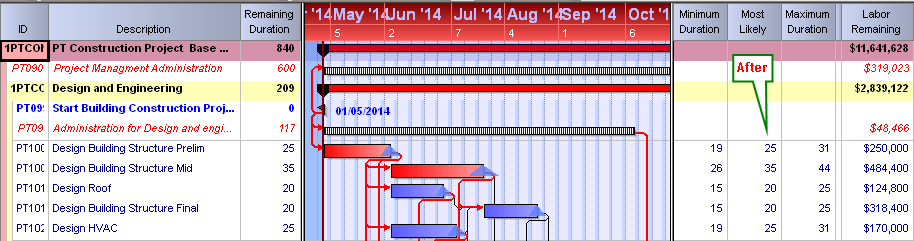
- This is the screen with the quick risk values loaded, ready to run the risk analysis.
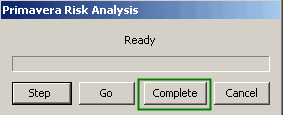
Clicking the Risk Analysis icon (dice) initiates the analysis. The first screen indicates the number of iterations that will be used during the analysis. The user also has the option to select the screen that will display on completion.

Opening the Options screen reveals the settings for calculating risk Data. After clicking OK to confirm the options, the process is initiated by clicking Analysis and you are given the opportunity to step through or to complete in quick time.
Viewing the Results
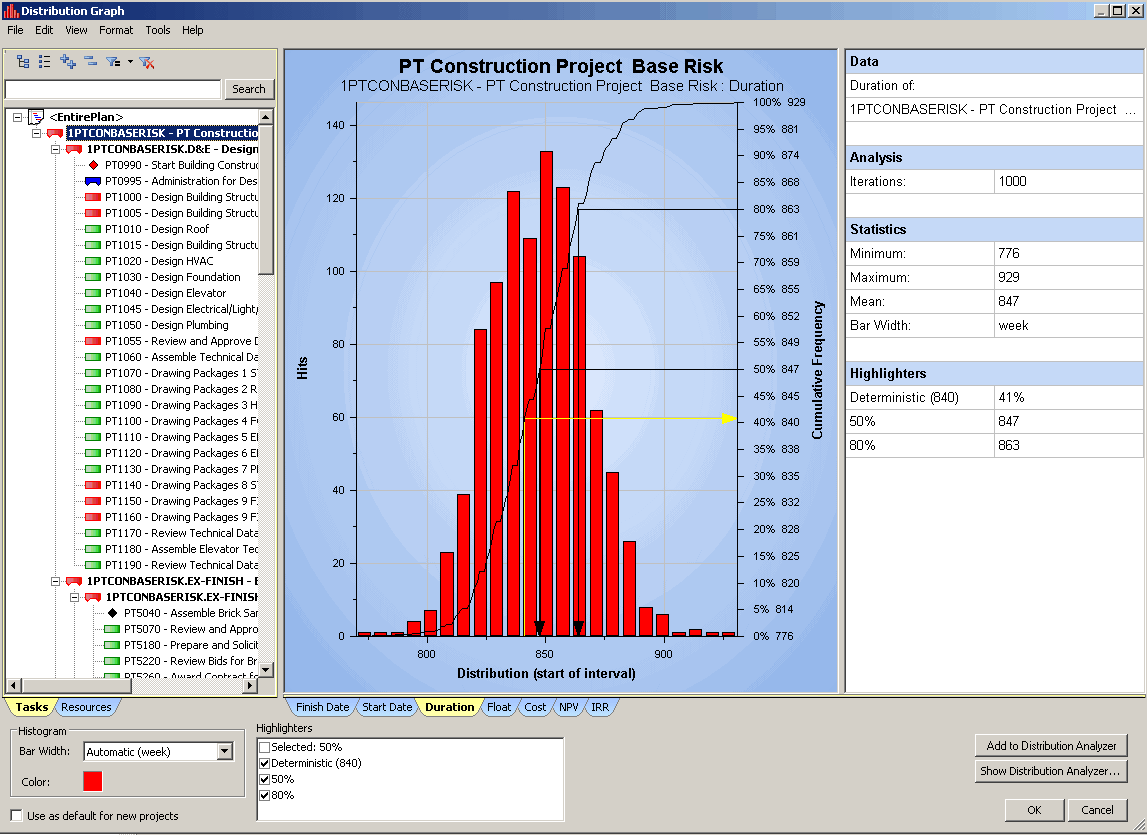
The Distribution Graph records all of the simulation results. The first data set is the Finish date data. You can select any activity to review the associated results. The yellow arrow indicates the Deterministic probability of achieving the schedule in its present configuration. PRA marks the P50 and P80 points and records the values in the table on the right. You can move the data lines up and down the scale to view the values at other percentile points.

Evaluate data by moving across the tabs Duration distribution. Here you can move through the Activities and view the individual results. PRA also records the Deterministic P50 and P80 values here. Clicking on any point on the vertical axis generates the values at a selected percentile point.
…JOIN PRESCIENCEADVANTAGE® PRIMAVERA SUPPORT
A PrescienceAdvantage® Primavera Support agreement is flexible, scalable and value driven. It offers functional and technical Oracle Primavera assistance, delivered remotely or on-site. Find out more about setting up a Support Agreement for your site, or call us on 1300 086 816.