Create and Use Deltek Acumen Fuse Metric Playlists
Deltek Acumen Fuse provides an outstanding set of Project Schedule Analysis tools. One of the great features of Acumen Fuse is the S2//Diagnostics feature. With Diagnostics you can choose from over 300 existing Metrics to use in analysis of project schedules.
The Metrics in Acumen Fuse are set out in three distinctive sets; the Default Schedule Quality set, the Advanced set with 20 sub lists, with the final set containing four Industry Standards, Metric groups.
This is the first in a series of Tips and Tricks covering Deltek Acumen Fuse and Risk. In this issue, we will cover how to set up your own playlist for an Acumen workbook.
For our examples we will be using Oracle Primavera P6 XER files.
These tips are relevant for all versions of Deltek Acumen Release R8GA and up.
Create Metric Playlist in Deltek Acumen Fuse
Even though there are defined default sets of Metric Playlists in Acumen Fuse, you will probably want to create your own custom Playlist. This may more closely meet your companies analysis needs.
Follow these steps to Create your own custom Metrics Playlist:
Step 1: Open Acumen Fuse and Link and Import the Project or Projects to analyse.
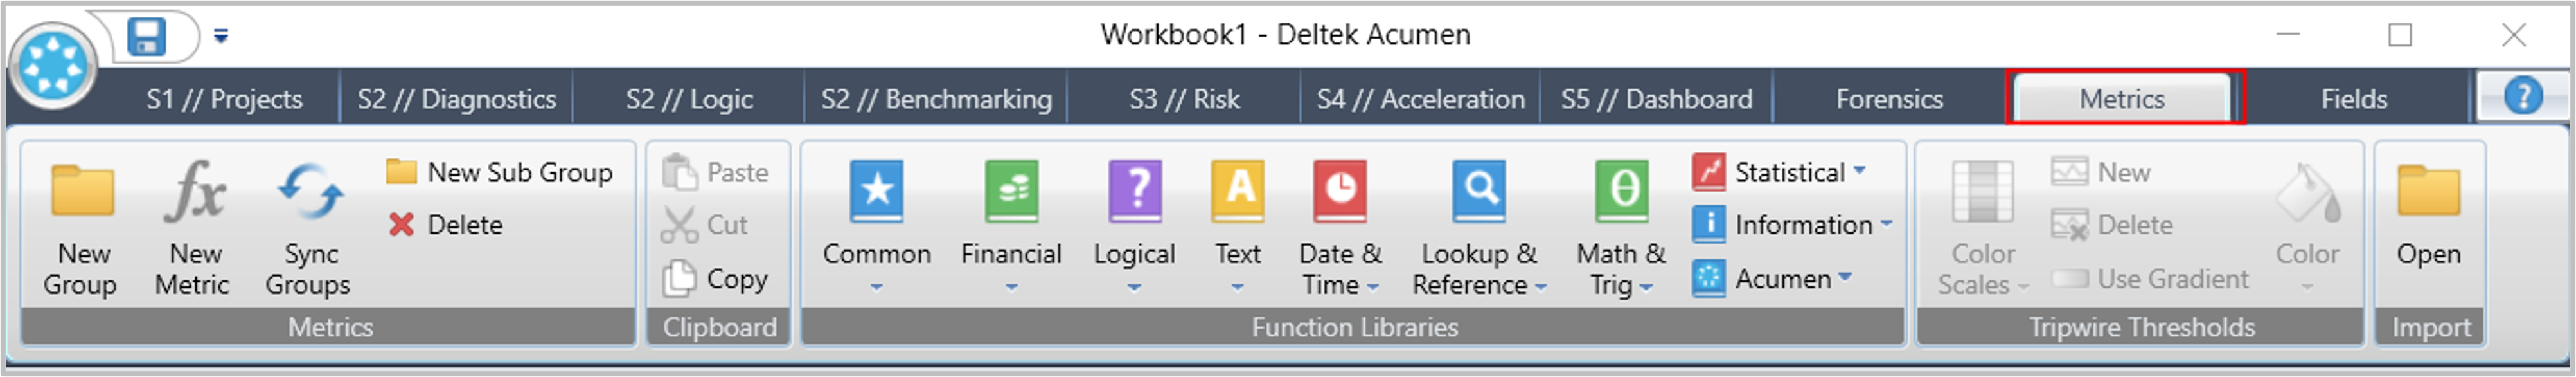
Step 2: Click on the ‘Metrics’ tab to open metrics.
TIP! The best way to create your new Metric Playlist is to start in the Metrics page. First create a new Metric Group and then populate the group with the metrics you intend to use.
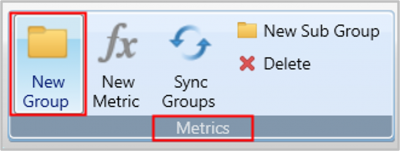
Step 3: In the Metrics panel click ‘New Group’.
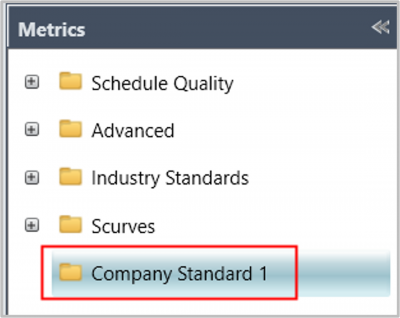
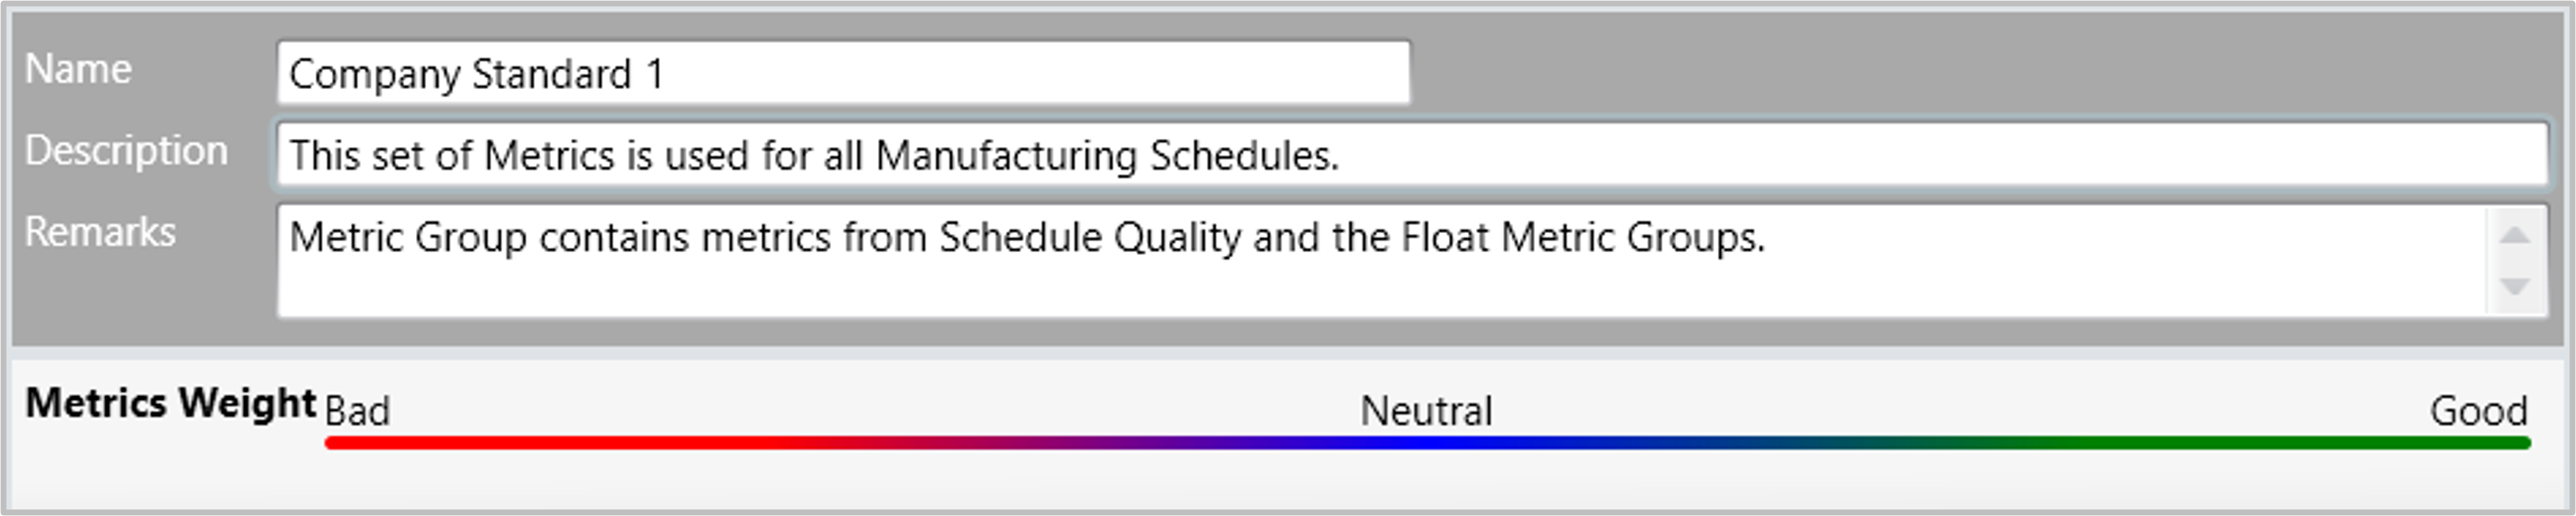
Step 4: Type a ‘Name’ for the Group.
Step 5: Type a short ‘Description’ for the Group that will assist users.
Step 6: Type any appropriate ‘Remarks’ for the new group.
TIP! Remember to Save the Workbook as you progress the work. It is also good practice to always save the workbook before starting any analysis.
Adding Metrics to your Metric Group
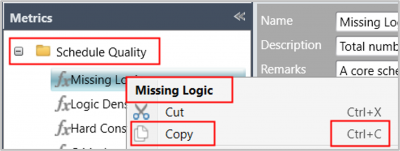
Step 1: In the Metrics panel expand Schedule Quality.
Step 2: Select the Metric to copy, right click and select ‘Copy’ or use ‘Ctrl+C’.
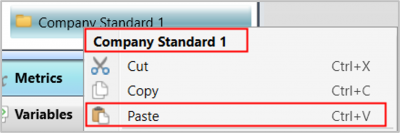
Step 3: Select the new ‘Metric Group’, right click and select ‘Paste’ or use ‘Ctrl+V’.
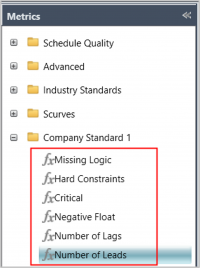
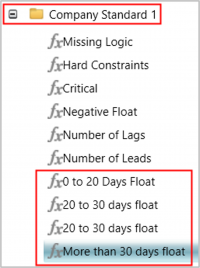
Step 4: Repeat the above to copy all the required metrics from the Schedule Quality Group.
TIP! In this case we have omitted several default Schedule Quality metrics based on the manufacturing process schedule. The decision to exclude a standard type metric is based on your own company knowledge of process.
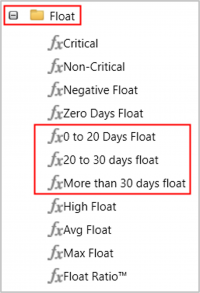
Step 5: In the Metrics panel expand the ‘Advanced Group’ and then the ‘Float’ Group.
Step 6: Select the Metric to copy, right click and select ‘Copy’ or use ‘Ctrl+C’.
Step 7: Select the new Metric Group, right click and select ‘Paste’ or use ‘Ctrl+V’.
Step 8: Repeat the above to copy all the required metrics from the Float Group.
Using the Metric Group in the S2//Diagnostics page
Step 1: Click the ‘Save’ icon to save the current work.
Step 2: Click on the ‘S2//Diagnostics’ page.
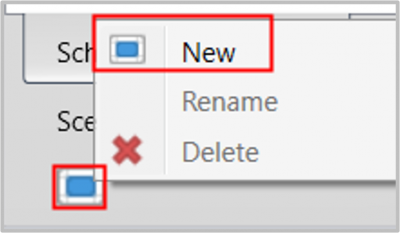
Step 3: In ‘Diagnostics’ click on the ‘Insert New Ribbon View’ icon and select ‘New’.
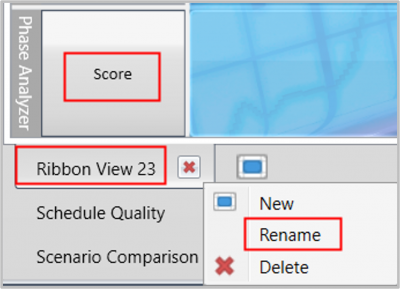
Step 4: A New Ribbon is inserted, right click and select ‘Rename’.
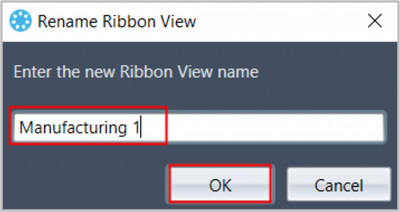
Step 5: In the ‘Rename Ribbon View’ panel, type the name for the new Playlist and click ‘OK’.
Step 6: Click on ‘Metrics’ to expand.
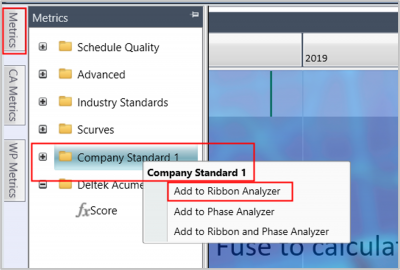
Step 7: Right click on your ‘New Metric Group’ and select ‘Add to Ribbon Analyzer’.
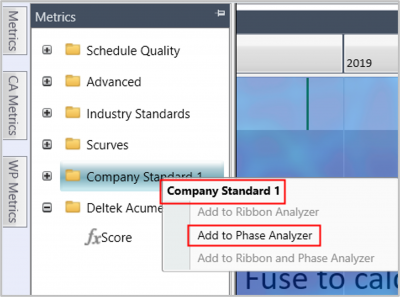
Step 8: Right click on your ‘New Metric Group’ and select ‘Add to Phase Analyzer’.
TIP! When creating your Ribbon View Playlist you can add all the metrics from the new Group in one go. By Default the Acumen Score Metric will be added to the new list.
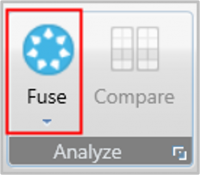
Step 9: In the ‘Analysis’ section click the ‘Fuse’ icon.
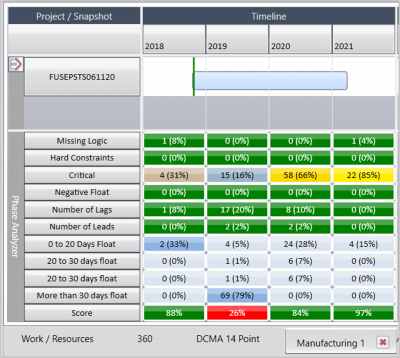
Step 10: The analysis is run, and the score generated.
Step 11: Click the ‘Save’ icon.
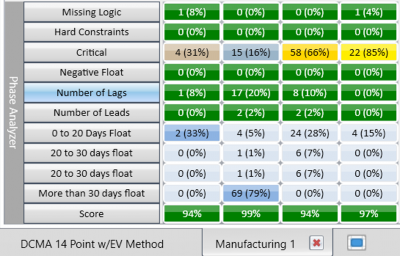
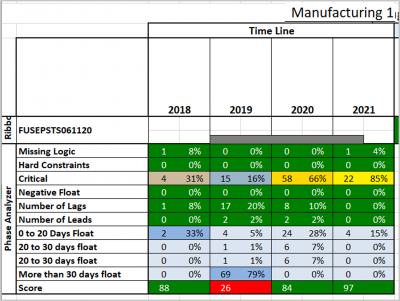
The Phase Analysis results.
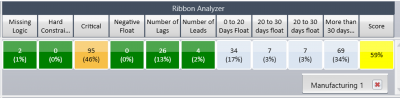
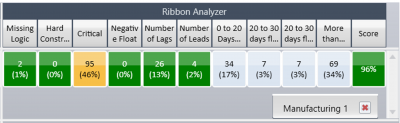
The Ribbon Analysis results.
Metric Group Scoring
Step 12: Click on the main ‘Metrics’ tab and select your new Metric Group.
Step 13: Review the settings and determine if changes are required.
Record your current settings before making any changes.
TIP! In the metrics tab you can change the score for the Metric Group by moving the sliders on each metric. Determining what is acceptable and what is not should be a prime task when developing your Metric Groups. Metrics will be examined in a Later Acumen Tips and Tricks.
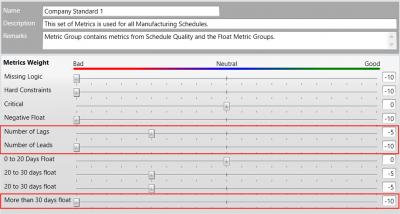
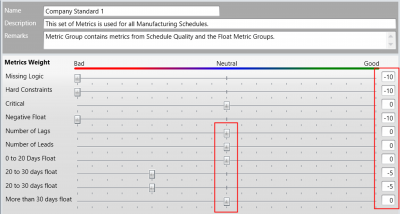
Step 14: Move the slider for .Number of Leads and Number of Lags to Neutral.
Step 15: Move the slider for .More than 30 days float to Neutral..
Step 16: Record your new settings after making the change.
TIP! Depending on the requirements and type of work Number of Leads, Lags and Float more than 30 Days might be considered for moderation.
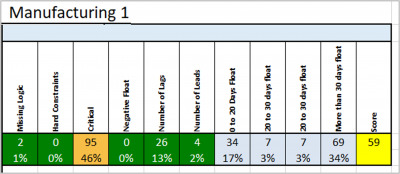
Metric Group Scoring Change
Step 17: Click on the ‘S2//Diagnostics’ tab.
Step 18: In ‘Analysis’ click on the ‘Fuse’ button.
Generate Fuse Metrics Report
Step 1: In this case the sliders are returned to the original settings before generating a report.
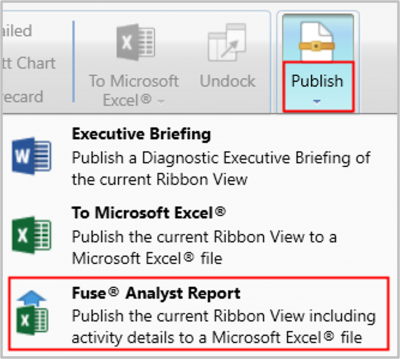
Step 2: In ‘S2//Diagnostics’ click on the ‘Publish’ button.
Step 3: Select ‘Fuse Analyst Report’.
TIP! There are several report formats available. Determine which is best suited to your needs and then either use the existing format or alter as required. Multiple tabs are generated providing detailed information on each element of the analysis. You can also copy detail to the Clipboard and paste in other documents.
If you would like to know more about any aspects of Deltek Acumen, Oracle Primavera P6 or using any of Oracle’s Primavera products to better support your project management capability, please contact us.
Prescience Technology is the premier Oracle consulting firm in Australia. Get in touch to find out how we can help boost your project management capability with our technology, training and project resourcing solutions.
Next Month’s Topic
Join us next month, when we will discuss User Defined Field Tabs, XLSX Imports and Global Change!