In this special Tips & Tricks article we provide some handy hints on grouping, sorting and filtering in Oracle Primavera P6 to show you how to create great P6 views and reports. This month’s topic was a special request and is one of the most frequently accessed articles from our Tips & Tricks catalogue.
Creating P6 views can be challenging at times, but with these hints at hand, you will be able to create great views and produce some top reports in no time.
Activity Sorting within Sub-Groups
In certain situations, a need arises where specific Activity IDs must be placed at the top of each sub-grouping while grouped by another activity code, WBS code, etc. Here we will demonstrate a quick way of sorting Activity IDs using Activity Codes and the sorting function.
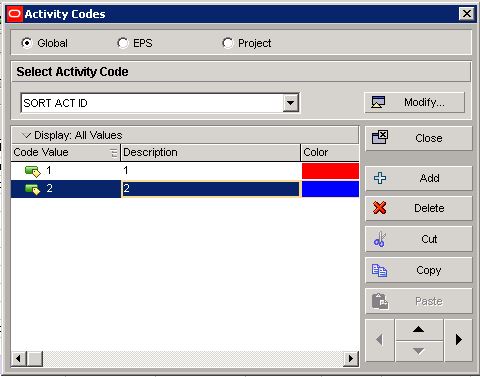
- Create a new Global Activity code to use for custom Activity ID sorting via the “Modify” button (i.e. “SORT ACT ID”).
- Add activity code values “1” and “2”.
- You may wish to add more values if you require a greater number of activity ID’s to be sorted rather than just one.
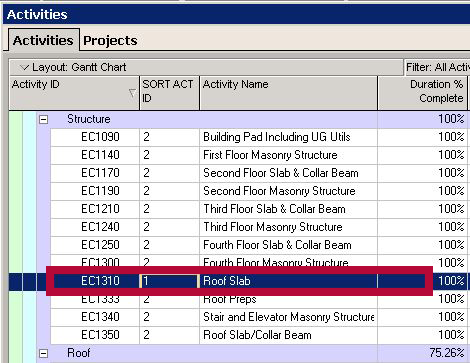
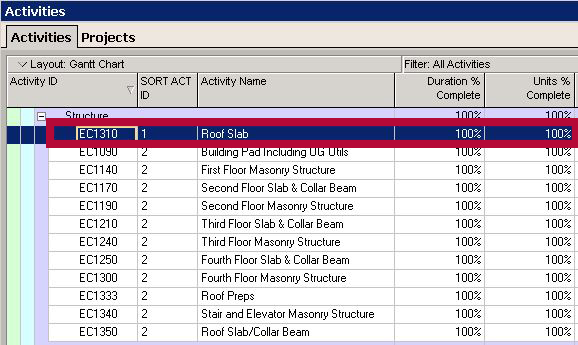
In the example below we will show how to place any Activity, in this case activity “EC1310″, at the top row position within its sub-grouping.
- Assign code value “1” to activity “EC1310″ and code value “2” to the rest by either manually entering the values or by using the Fill-down function.
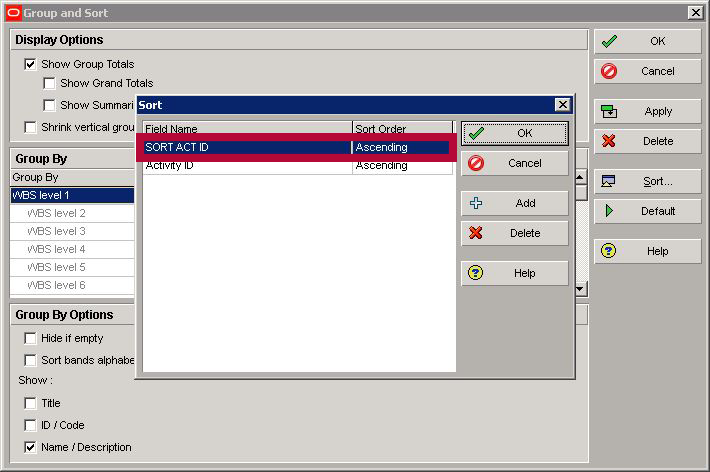
- Select “Group and Sort” and then the “Sort” button on the right.
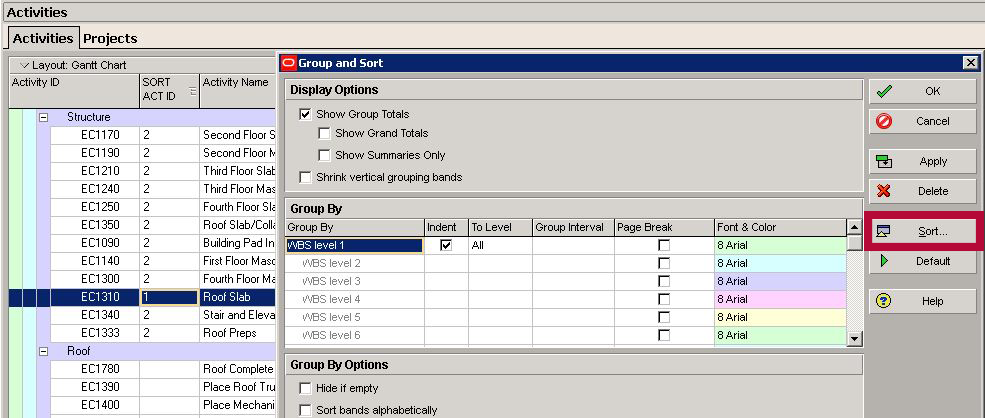
- Add the new Global activity code “SORT ACT ID” as the first sort order by Ascending sort, select “OK” and then within the Group and Sort select “Apply” and “OK”.
- Below is the result with the targeted activity “EC1310″ having the top most sort position, with the rest of the Activity ID’s sorted by ascending order (EC1090, EC1140, EC1170, etc.)
Displaying Summary Bars Simultaneously
When viewing summary bars within the Gantt Chart, there will be times when displaying a baseline summary along with any other summary bars would be advantageous; and would enable a more robust reporting view to pass onto a manager or team member. To show the Baseline Summary Bar along with the Current Summary Bar follow these easy steps:
- Go to View, Bars, (or click the “Bars” shortcut) and select the “Add” button.
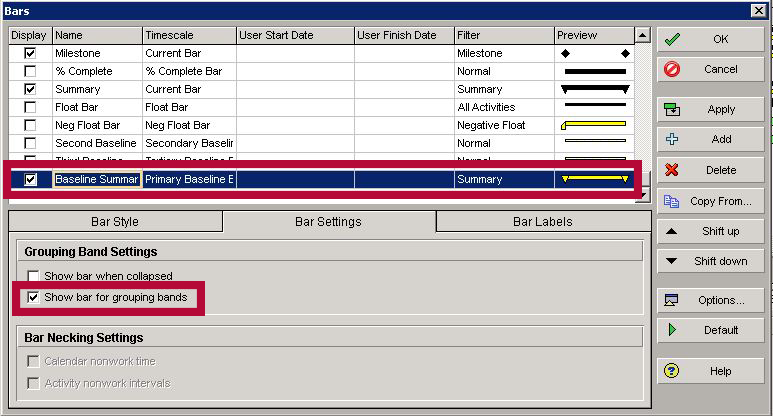
- Enter a name for the new Bar (in this example “Baseline Summary”)
- Select the “Timescale” for the Baseline you wish to Summarize. For example, select “Project Baseline Bar” to show a summary of the Project Baseline, or the “Primary Baseline Bar” to show a summary of the Primary Baseline etc.
- Go to the “Bar Settings” Select the option “Show bar for grouping bands” (this will set the Filter to “Summary”).
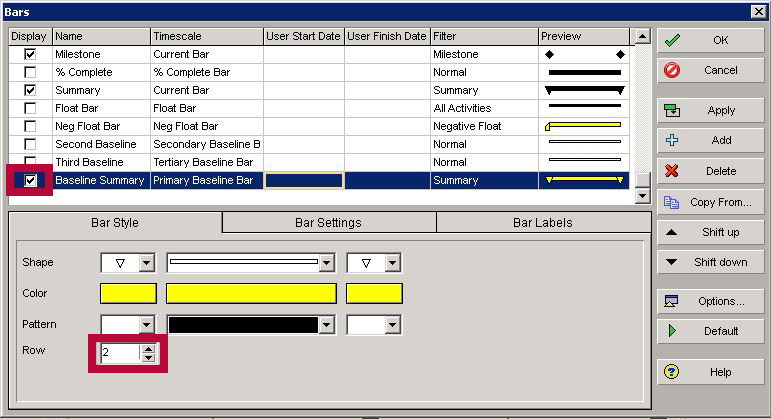
- Go to the “Bar Style” tab, and configure the Bar width, colour and endpoints. If this is a second Summary Bar in the Layout, then you may wish to set the “Row” value to “2”.
- Finally, Make the Bar visible by enabling the ‘Display’ option.
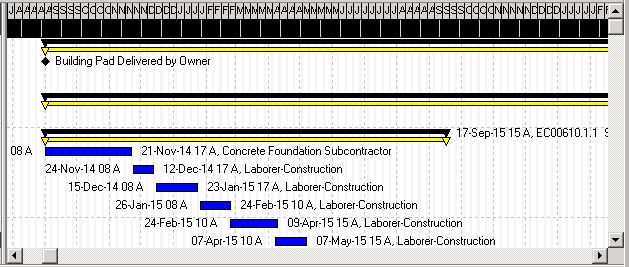
- Below is an example showing current in the black Summary Bar, and Baseline in the yellow Summary Bar.
Creating a filter to compare two fields
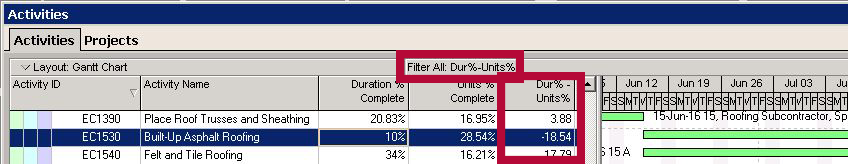
In some cases, P6 supports the ability to filter, or select, the difference between two fields. Here we will demonstrate a neat trick on how to select which activities have a Duration % Complete that does not equal Units % Complete. We will create a User Defined field to store the difference, use Global Change to calculate the difference, populate the User Defined field and then finally, to filter on the User Defined field.
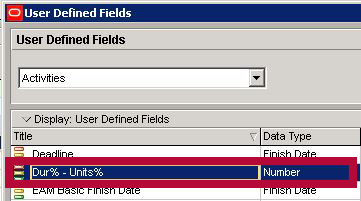
- Define an Activity level numeric User Defined field to store the difference.
- Go to Enterprise, User Defined Fields, and then “Add” and name a field as “Dur% – Units%” and select the Data Type as “Number”.
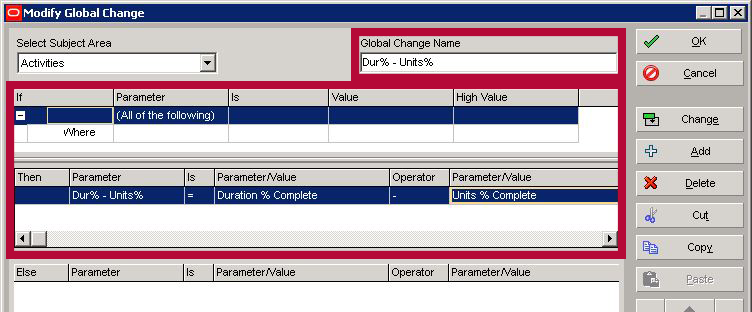
- Once the UDF has been created, go to Tools and select “Global Change”.
- Create a New Global Change to populate the User Defined Field, Dur% – Unit%, as shown below using the formula:
Dur% - Units% = Duration % Complete - Units % Complete
- Create a Filter to select those User Defined field values that meet your criteria:
Where “Dur% - Units%” is not equal to “0.00”
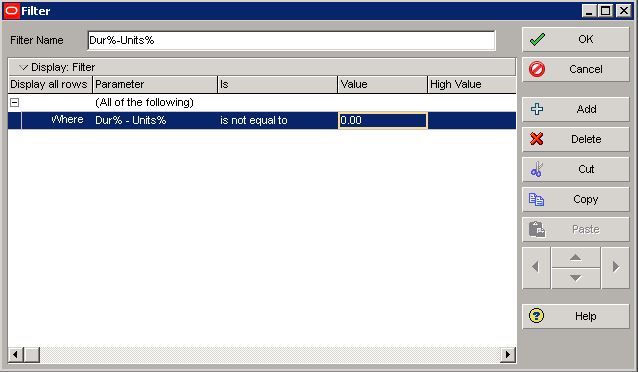
The User Defined field is now populated with the calculated value and the view is filtered to only display the activities with a difference between Duration % Complete and Units % Complete.
…JOIN PRESCIENCEADVANTAGE® PRIMAVERA SUPPORT
A PrescienceAdvantage® Primavera Support agreement is flexible, scalable and value driven. It offers functional and technical Oracle Primavera assistance, delivered remotely or on-site. Find out more about setting up a Support Agreement for your site, or call us on 1300 086 816.